Imagine Deliver Case Study
Multi-touchpoint strategy
Summary
Imagine Deliver is a Minneapolis-based consulting firm that focuses on inclusive design and equitable strategies to produce structural changes and system redesign within their client’s organizations and businesses. They mainly work with senior executives and organizational leaders. Imagine Deliver reached out to Prime’s user experience team with the goal of becoming well-known thought leaders in the consultancy space to attract larger national clients who are willing to make significant structural changes within their organization. Our team proposed a four-phase multi-touchpoint strategy that focuses on clear, redundant, and consistent messaging across their content and platforms along with launching “Imagine Big Ideas,” the content umbrella that houses their thought piece platform and a new podcast.
My Role
User Experience Researcher and Designer
Team DELIVERABLES
Guiding Strategy Statement
Team
Colleen Borgendale (myself)
TOOLS
Zoom
Figma
Pen and paper
Google Sheets
Kanban Board
Figma
iMovie
METHODS
Know, Don’t Know, Assume
Comparative Audit
Deep Dive Research
Stakeholder Interview
Content Audit
Persona
Touchpoint Strategy Map
Prototypes
Annotated Wireframes
Video Presentation
The Problem
Since its inception, Imagine Deliver’s client list has grown mainly through word of mouth. They are ready to increase their impact and become thought leaders in the consultancy space and work with more large, national clients.
Research
My team and I conducted a variety of secondary research on Imagine Deliver and their competitors. We did a content audit of their website, a competitor audit, an exercise outlining what we knew, didn’t know, and assumed about Imagine Deliver, deep-dive research into their social media, and assisted with a stakeholder interview with Imagine Deliver’s co-founder and operations manager. From this research, we put together an affinity diagram to help understand the full scope of Imagine Deliver.
Some LinkedIn Notes from the Deep Dive Research
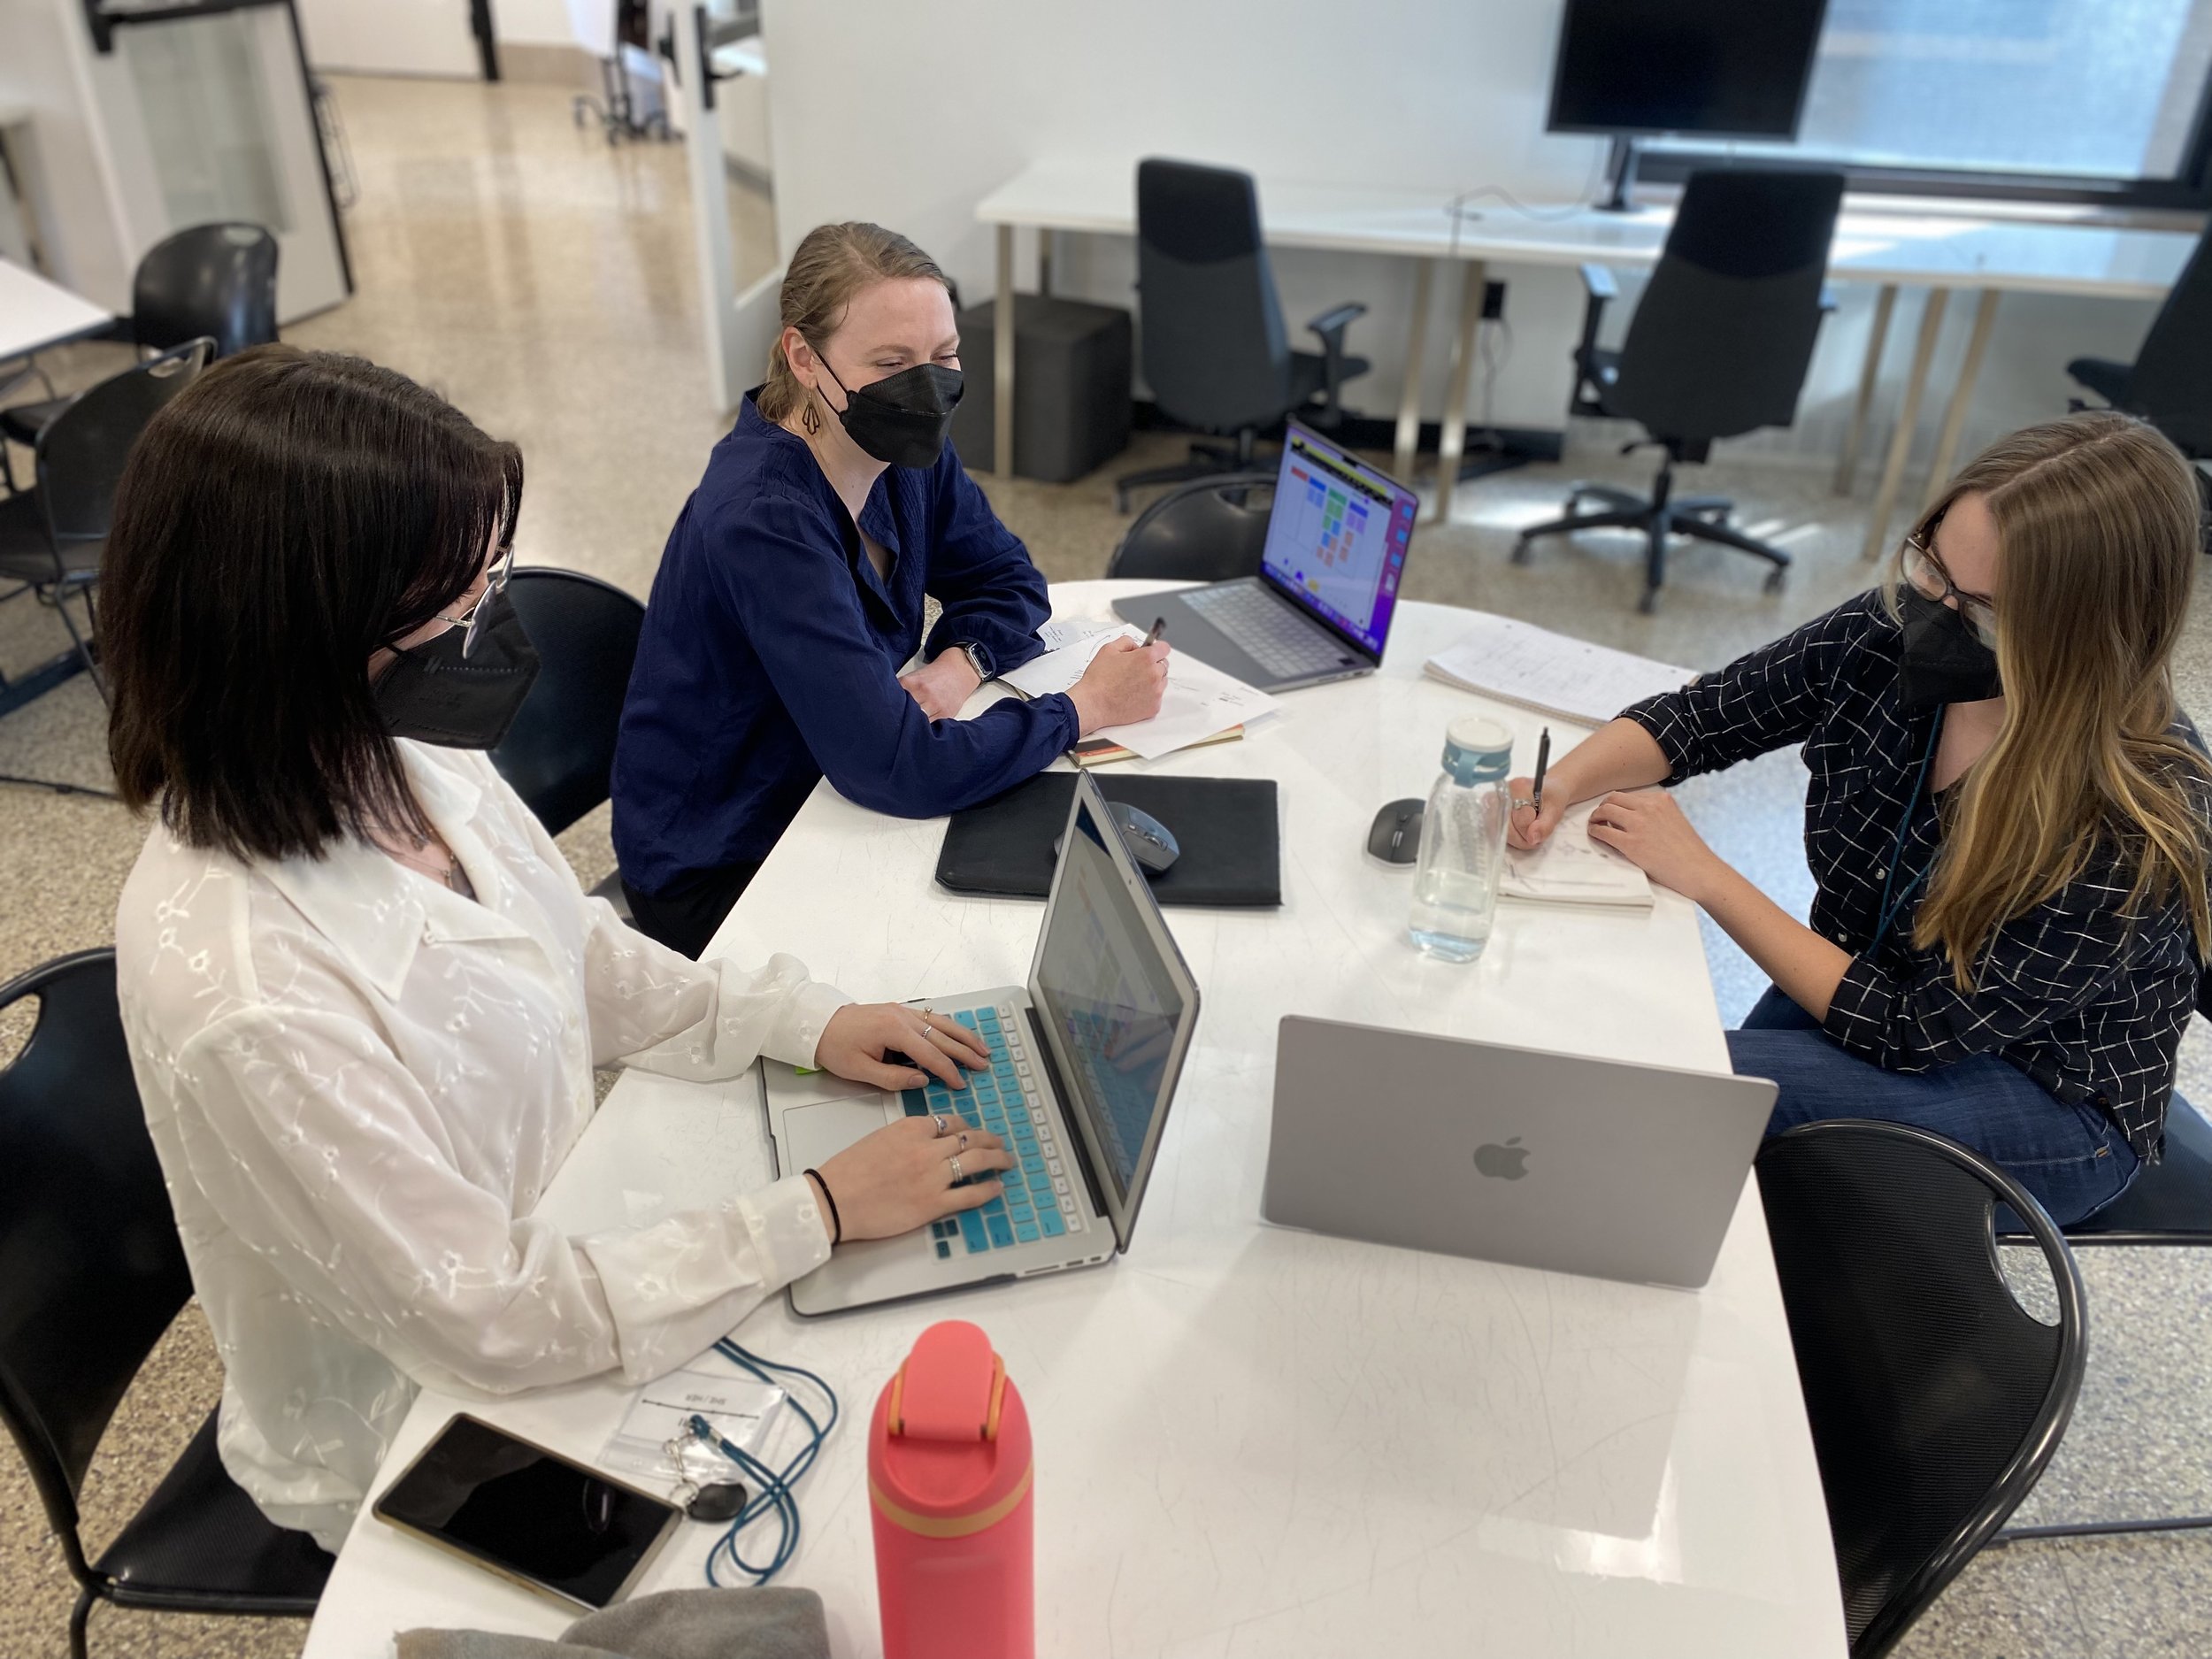
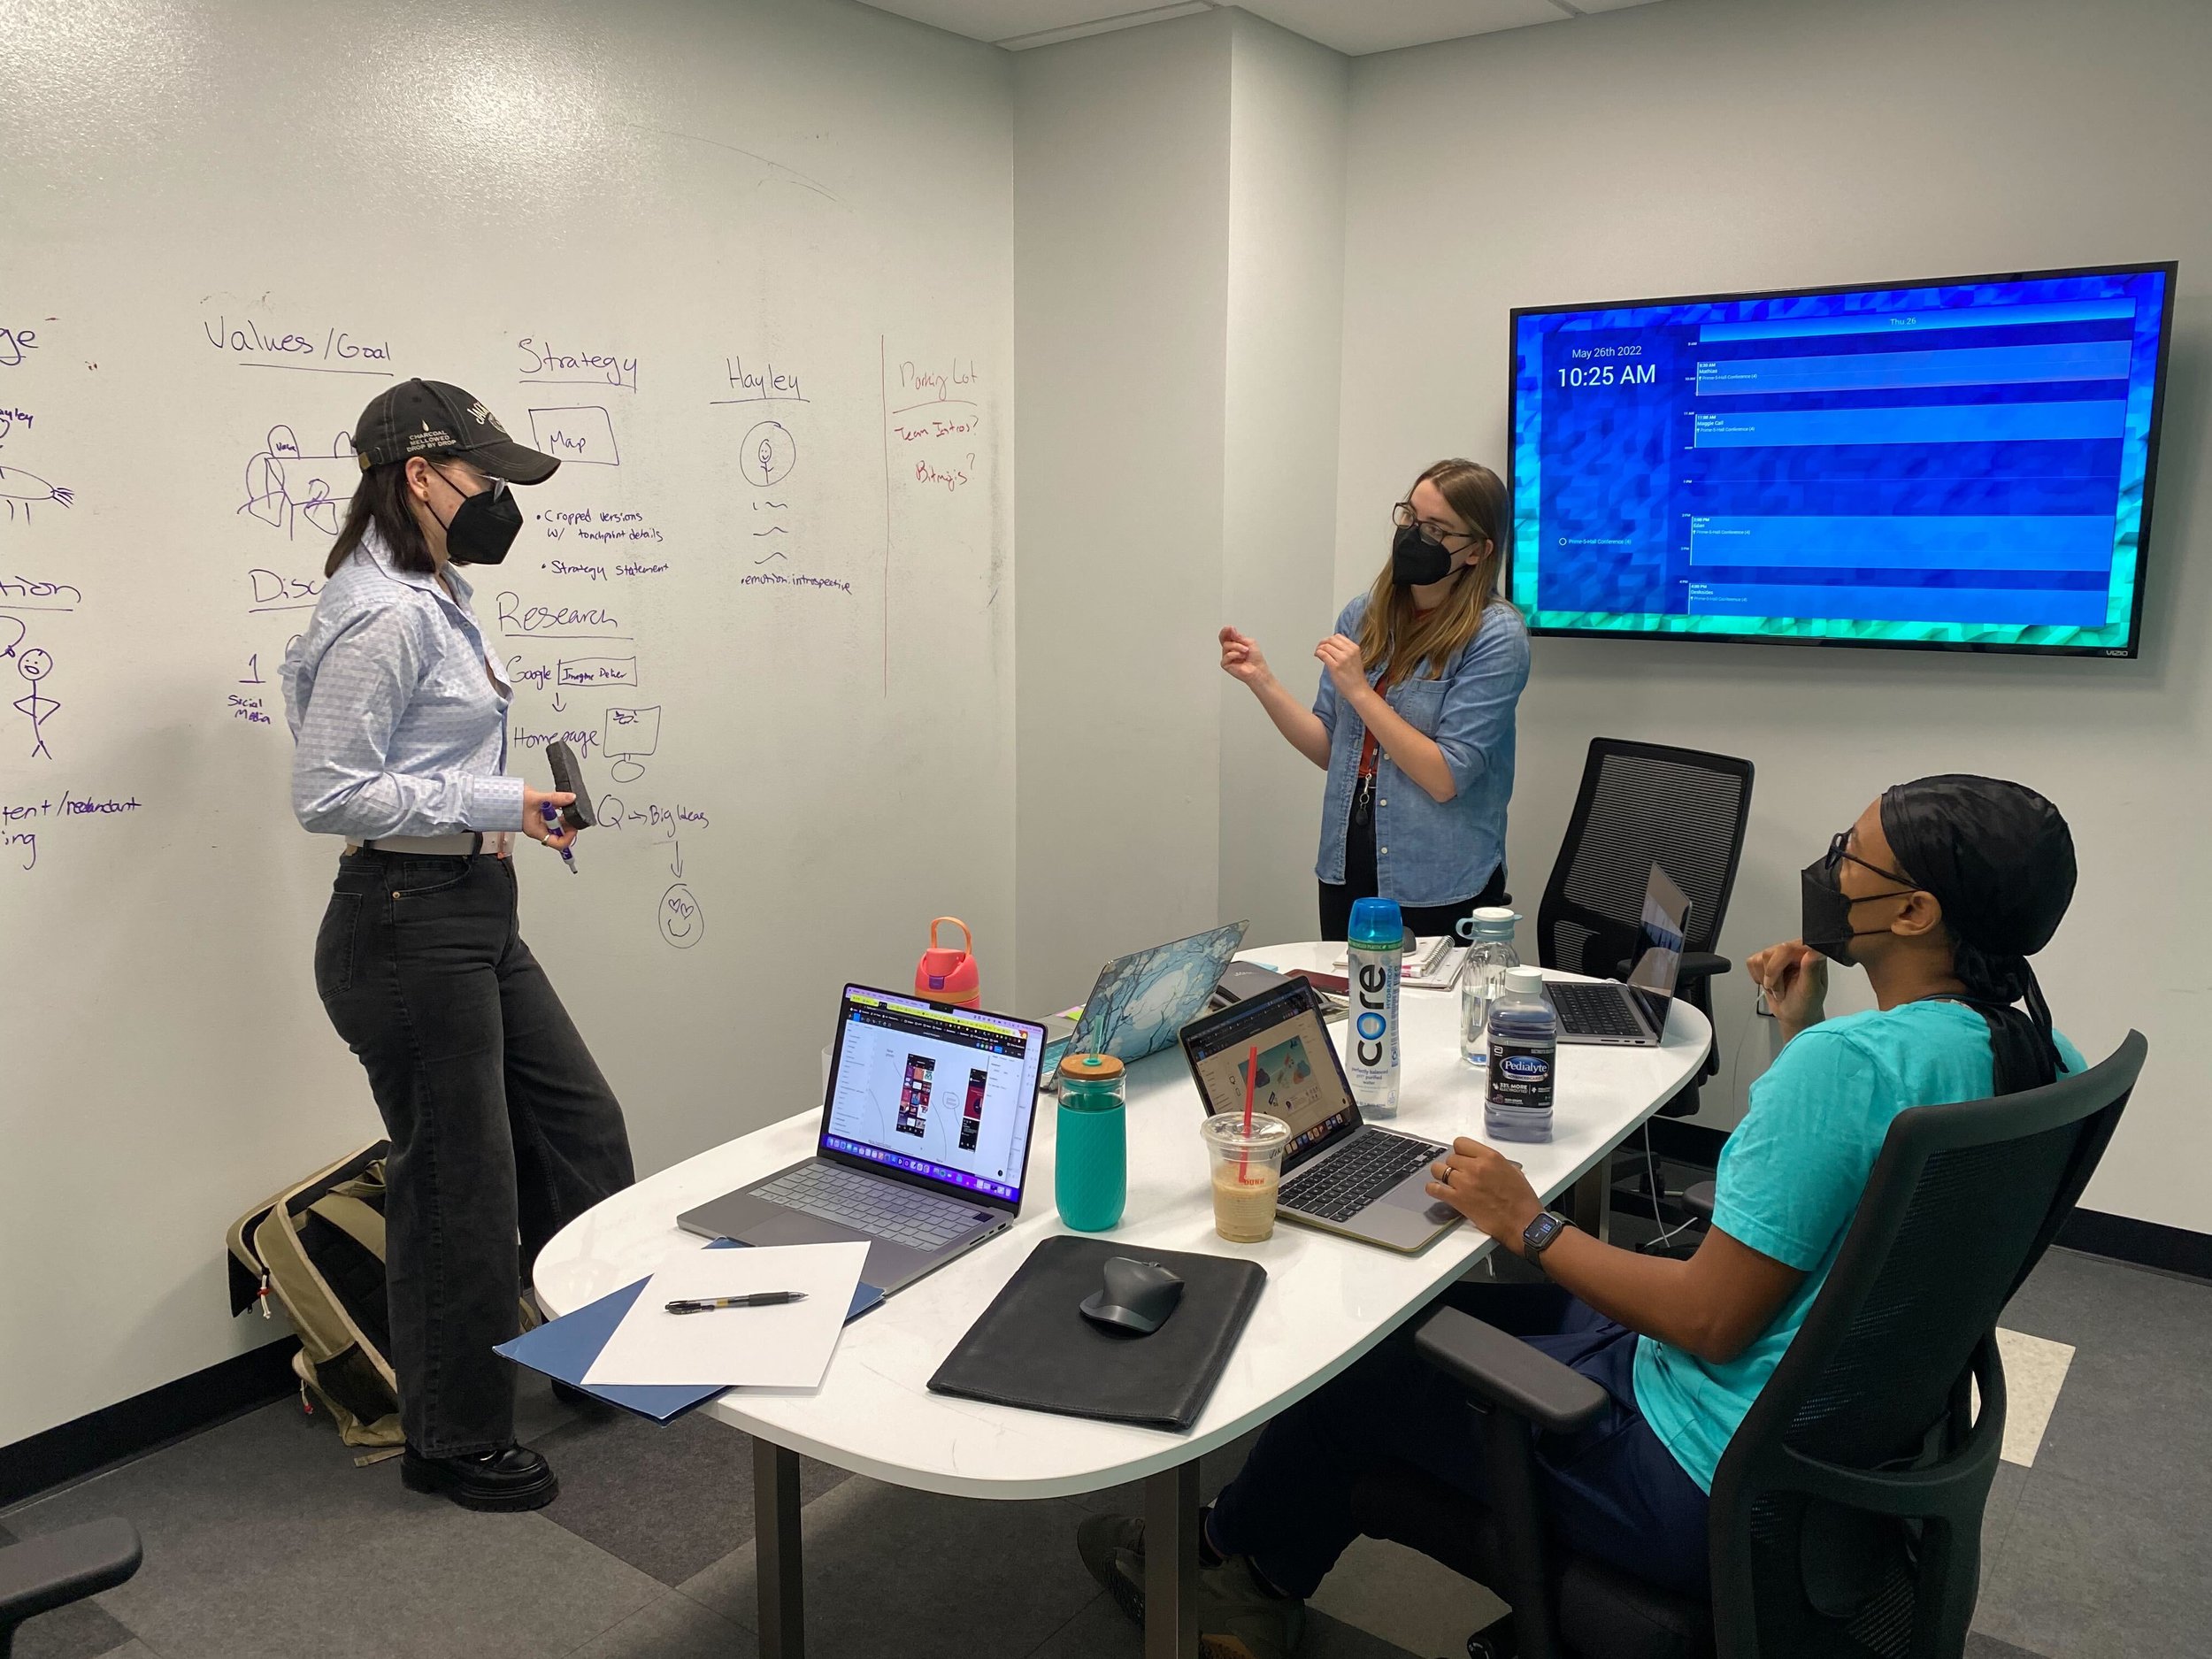
Some members of our team working on research
Guiding Strategy Statement
After analyzing Imagine Deliver’s website and social media content, researching their competitors and the consultancy space, and participating in a client meeting, we created a guiding strategy statement.
All user experience touchpoints for Imagine Deliver will help leaders with the capacity to make change feel introspective and confidently empowered so that they are able to make structural changes. Our strategy does this by focusing on clearly articulating what they offer and who they are and developing consistent thought-provoking content. As a result, we hope to see a change in touchpoint engagement and more national clients ready to make big impacts.
Touchpoint Strategy Map
From the guiding strategy statement, my team and I planned out the Touchpoint Strategy Map. We broke out the process into four phases, focusing on the period between a user hearing about Imagine Deliver to becoming a client. These phases include touchpoint changes and additions to the Imagine Deliver website, social media, and overall content that would help achieve the goals identified in the statement. The content strategy centers around the concept of “Imagine Big Ideas,” thought pieces, and a podcast dedicated to Imagine Deliver’s goal of transforming systems. Our strategy includes repetition and consistent messaging across the touchpoints, including:
Imagine Big Ideas, monthly thought pieces that dive deep into Imagine Deliver’s solutions, with research backed by the firm’s case studies
New weekly podcast series that breaks down Imagine Deliver’s solutions to big questions, features previous clients as guests, and dives deeper into the Big Ideas content.
Consistent social media posts across all platforms, such as Instagram and LinkedIn, that pull from the Big Ideas content, new case studies, current content, and sharing other business and organizations’ content
The redesigned homepage helps to clearly and succinctly communicate who is Imagine Deliver to unfamiliar users. It also puts the Imagine Big Ideas front and center to help establish them as a thought leader. A sign-up form for the newsletter is added to the homepage for easy and quick sign-ups to help build on the success of the current newsletter.
Updated case studies are arranged based on industry with multiple case studies shown for each industry. This gives readers a better understanding of the methods Imagine Deliver uses to make structural changes within organizations.
Touchpoint Strategy Map Design by Samantha Heggem
Touchpoint Prototypes
Imagine Big Ideas Through visual storytelling
Thought leader articles, housed under the umbrella “Imagine Big Ideas,” become the heart of the Imagine Deliver content serving as the basis for social media and podcast content. Visual storytelling would be the vehicle for displaying and communicating this content, utilizing large imagery, video, quotes, charts, graphs, stats, and body copy that becomes dynamic as the user scrolls down the page. The inspiration is pulled from visual storytelling featured on the New York Times, the Atlantic, and the digital service Shorthand.
A bold large image or video header
A video of b-roll footage or a large image sets the stage and tone of an “Imagine Big Idea” thought piece. This pulls the user in and invites them to explore further.
Big Idea audio
Every Image Big Idea thought piece would include an audio recording of it, similar to a news organization’s use of Audm, to make the article more accessible and easier for a busy user to consume the content.
Body copy
The body copy would flow throughout the page, but be broken up with other graphic content to help the user stay engaged and enhance the written content.
Image or video with a quote
One component available to add more graphic content would be an image or video area with a quote. Depending on the size of the image or video or graphic content being communicated, as the user scrolls, the quote could move or one image could fade into another.
Two-column layout option
Content could be broken into a two-column layout to feature a component such as an image, video, chart, graph, or statistic in one column and the other column could feature body copy.
Stats
To show quantitative data, stats can be easily displayed in the article, and animation added to them.
Charts and graphs
Charts and graphs are another way to show quantitative data, helping to show the science and reasoning being the arguments in a thought piece.
Newsletter signup
A newsletter signup wraps up this page, giving users a way to stay in touch with more of the big idea thought pieces created by the team.
Client Presentation and Video
As a team, we compiled our research findings, strategy, and prototypes into a final package for the client with a video presentation and a brief findings and recommendations report. We collaborated on storyboarding the video, writing the script, narrating the video, and creating the video slides, and I put together the final video. The recommendations report included the touchpoint strategy map, persona, and annotated wireframes.


